III. GDP and other economic indicators
Nominal GDPGross domestic Production (GDP) is deemed one of the most significant and frequently used economic indicator as it can somehow reflect the standard of living and the apparent situation of an economy. It measures of national income and output for a given country’s economy in a specific period of time.

Graph 1
household consumption: 59.5%
government consumption: 12.2% investment in fixed capital: 19.4% investment in inventories: 0.3% exports of goods and services: 73.1% imports of goods and services: -64.5% (2013 est.) |
Graph 2
Taiwan’s GDP have a stable and sharp increase since 2000, from 326 billions of U.S. dollar in 2000 to 489 billions of U.S. dollar in 2015, which was also the highest among previous years. Refer to graph 2 and correlate with graph 1, graph 2 shows the component of GDP of Taiwan, it is largely contributed by household consumption, and comparatively small by government consumption. Linking with graph 1, the ballooning GDP, this likely reflects that Taiwan citizens’ material standard of living is enhancing overtime. We can further prove this by having a look on the following parts discussing the real GDP, GDP per capita and other indicators.
There is a drastic drop of GDP in 2001, a sudden shrank of 4.2 percent in the third quarter. Taiwan suffered from recession as there was a rapid dropoff in demand for electronics products from United States, Taiwan’s biggest export market (You may also refer to our First part: Economic history of Taiwan for more details) [1] , and the deflationary pressure in asset market, the continuous credit crunch have led to production cutbacks. It starts to recover steadily due to the expansionary monetary policy adopted. [2]
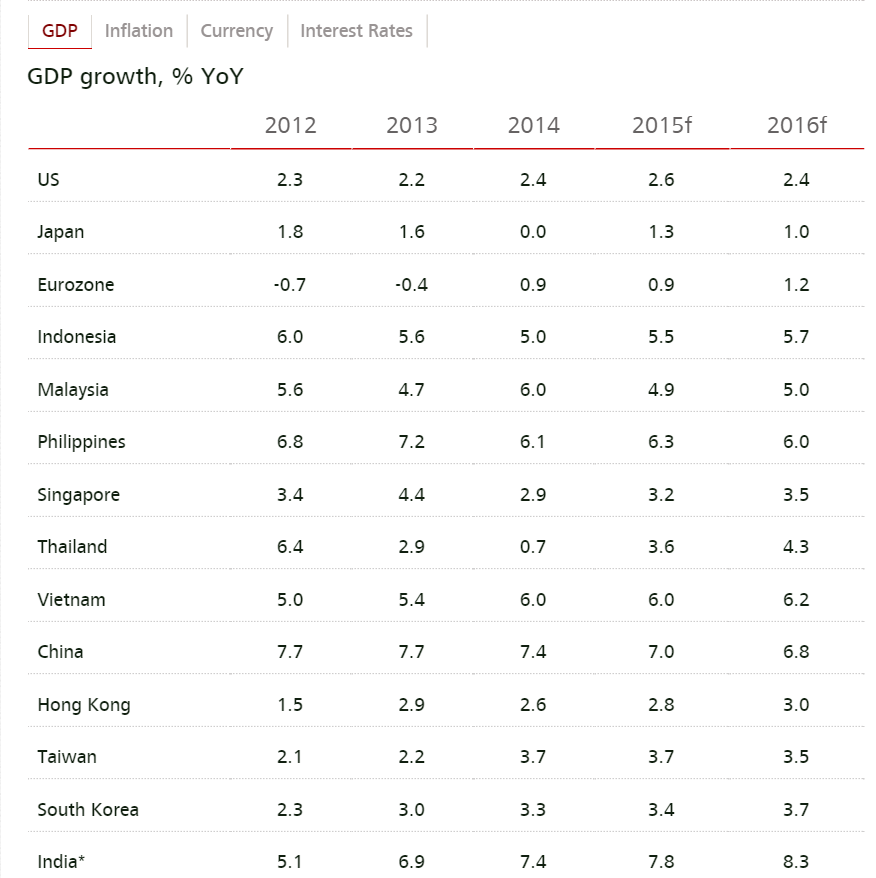
Graph 3
The GDP growth rate of Taiwan is increasing
over the past few years. On a city basis, its size and resources has limited
Taiwan to compete with countries like China and Vietnam as it cannot launch a
large-scale production or industrialization as them but to face keen
competition on developing tertiary industry. However, a GDP growth rate of 3.7%
in 2014 is on par comparing with other cities. Taiwan can maintain its status
among “East Asian tigers”, which has a similar or even higher GDP growth rate
than Singapore, Hong Kong and South Korean in 2014, and according to DBS SME
Banking, Taiwan is estimated to advance steadily and keep the position.
Real GDP

Graph 4
Graph
4 shows the trend of real GDP of Taiwan from 2000 to 2015, overall, it
indicates the rise of real GDP of Taiwan and the standard of living of
Taiwanese since it is the inflation-adjusted value. Some country may have high
GDP at current price but we cannot confidently conclude that it has a high
standard of living as the price of goods and services might be high too.
However, real GDP, known as the GDP at constant price, which means using the
price of base year to calculate can more likely show the real production
situation of an economy. Thus, besides showing the improving standard of
living, it also gradually manifest Taiwan has become a productive country.GDP per capita

Graph 5
Graph 5 shows the real GDP per capita of Taiwan economy, GDP per capita is a more
accurate economic indicator reflecting the standard of living of people since
it is population-adjusted. Even if an economy has a high real GDP, we can
analyze that this economy is productive, but we cannot conclude that the people
have a high standard of living because population of economy is a major factor
too. An economy with high real GDP and large population might reflect a low
level of standard of living. Studying graph 4, we can know that the material standard
of living of Taiwanese is actually increasing overtime, it is likely that more
goods and services are available to consumers and consumers are in a better
position to buy them. From 1980 to now on, the GDP per capita has increased in four-fold.

Graph 6

Graph 7
Ranking the 29th based on the
GDP per capita on a purchasing power parity (PPP) basis, Taiwan has scored a
quite high ranking already. PPP, calculated in U.S. dollar, determine U.S.
prices against domestic prices. The price stability is vital in calculation, on
which Taiwan focuses so heavily and thus its purchasing power leap ahead of
many cities, and even some advanced countries like Japan [3]. Though it is
still way far from overtaking economies like Singapore and Hong Kong due to the
problem of relatively lower labour productivity.
There is another metric measuring only
actual individual consumption, in which Taiwanese spending US$25129 per capita
beats Singaporeans (US$24725), Japanese (US$24447) and South Korean (US$17481).
[4] This measure is a better indicator to show the material well-being of
people than GDP per capita since components such as military is not related to
their life. This can focus on their consumption and can better reflect the real
material living standard of people.
Taiwanese is enjoying
a quite high material living standard as a whole. China and Japan are known as
the 2nd and 3rd large economy, measuring of its GDP, but
they have a ranking of 121th and 37th comparing to
Taiwan, meaning each person in Taiwan is sharing a high value of GDP. We will
consider the Gini coefficient in the later part to see its standard of living
in a more accurate way)
Gini coefficient-Distribution of wealth

Graph 8

Graph 9
According
to graph 8, the problem of income inequality seems not severe, as Taiwan only
rank 94th and the Gini index is much lower than others. Also, the
Gini coefficient of Taiwan didn’t exceed 0.4, which seems not grave at all.
However, we can have a look on graph 9, is shows that the Gini coefficient of
Taiwan is low comparing to others, however, for disposable income, Taiwan’s
Gini coefficient rank much higher since the government didn’t adapt policies to
help the underprivileged such as transfer payment or induce higher taxes on the
wealthy people.

Graph 10
From
the above graph, it indicates the gravity of the problem of uneven distribution
of income. There is a trend of increasing wealth gap, the top 20% of people
owns much more than the lowest 20% of people. It means that there may be large
variety of high quality goods and services available in Taiwan but lots of
Taiwanese may not be affordable, which affects the well-being of living
standard. The government should improve the situation without further ado, or
else the Gini coefficient may exceed the line of 0.4.
Consumer Price Index-Inflation
.jpg)
Graph 11
The
above shows the consumer price inflation rate over years of Taiwan, it
fluctuates a lot, experienced inflation and deflation. Overall, the problem of
inflation is not severe. During, 2003 and 2009, they are the two great
recessions of Taiwan. In 2008, there is a sharp increase due to the financial
stimulus plan and then the economy suffered from a financial crisis and fall
drastically. Although it rebounded a little bit in 2010, it is only half of
2005’s rate.

Graph 12
Comparing with other economies, Taiwan’s
case is definitely not severe, it ranked only 208th on its inflation
rate (consumer price), referring to graph 11, the inflation rate of Taiwan is
most likely between 1% to 2%, in which Hong Kong and Singapore have around 5%
inflation rate. It is because Taiwan has a tight control on price level,
especially in pharmaceutical market.
Inflation rate on
consumer price is much more reliable than GDP deflator when we measures the
living standard since CPI only focus on consumers’ consumption. It measures a
basket of consumer goods and services while GDP deflator measures all domestic
goods and services produced in a specific period of time CPI also have
different weighting according to our consumption pattern, which can reflect the
living standard more accurate.
Unemployment rate

Graph 13
The
unemployment rate of Taiwan has been fluctuating from 1980, but it is gradually
increasing as well, from around 1% to around 4% to 5%, which can be deemed
drastic. The peak in 2010 is due to the financial crisis encountered in 2008
and the economy went down a recession, in 2003 Taiwan also faced a great
recession, pushing the unemployment rate to rise. After the financial crisis in
2008, the government immediate adopted policies to stimulate the economy and
boost youth employment.
The youth unemployment rate seems more
severe, having a unemployment rate of 12.27 percent [5] , which will be a
problem correlate with aging problem in the society, Taiwan should consider the
labour participation rate.
Conclusion
Taiwan as a whole can enjoy a high material living standard studying the GDP
per capita and real GDP. However, not everyone can enjoy or have this
privilege, the problem income inequality is becoming more and more grave. Generally
speaking, the standard of living of Taiwan may not be as good as we see from
data, as it cannot be determined merely by GDP or Gini coefficient and etc., it
also measures the leisure time, the working hours and the environment of
Taiwan, but Taiwan fails to perform well in these facets, its long working
hours has long been the subject of discussions, and the government has not
attach much importance on the conservation of environment yet. Therefore,
whether the living standard of Taiwanese is good or bad needed debates.
However, by looking at the data and graph, we can conclude that comparing with
other economies, Taiwan perform well already, especially on price levels.
Reference:
Graph
GDP over time
GDP component
Real GDP in TWD
billion
Real GDP per
capita
Real GDP per
capita ranking
PPP adjusted real
GDP per capita in 2005 prices (chain series) from the Penn World Tables in
international USD from 1950 to 2009
GDP growth rate
comparison
Gini index
ranking
Gini coefficient
comparison
Gini coefficient
of Taiwan
CPI
Inflation
rate ranking
Unemployment rate
Data
CNN News Taiwan
hits recession with GDP drop
Taiwan’s Economic
recession and recovery in the New Government Regime
Correct take on
Taiwan’s high purchasing power
Taiwan beats Japan,
South Korean in per capita spending
Youth unemployment
沒有留言:
張貼留言